一张图秒懂十年地球人口变化 印度增2亿(双语)
导语:10年间,地球的人口到底发生了什么样的变化?最近,红迪网(Reddit)一用户制作了一张世界人口变化的地图,人口增长,则版图变大,人口减少,则版图变小。根据这张地图,印度的人口增长最多,10年间增长了2亿人口,而中国的人口大约增长了6000万,美国和英国等发达国家人口变化较小,俄罗斯、澳大利亚和加拿大等国家人口却显著减少。此外,10年前,这位用户就制作了相同的地图。
A world map redrawn according toeach country's population reduces the size of some countries, keeps many the same, and has a few that show an enormous shift。
最近,一用户根据各国人口重新绘制了一张世界地图,地图显示:一些国家人口减少,许多保持不变,而另一些则增长迅速。
The new cartogram, created by Reddit user TeaDranks, visibly compares all of the world's countries, with many, including the United States and United Kingdom, staying almost exactly the same in terms of size versus their actual land area。
这张新统计地图是由Reddit用户TeaDranks制作,以图形形式反应了所有国家的人口变化,其中,包括美国和英国在内的许多国家,人口并没有发生明显变化。
Others however, especially India,show massive growth, this as a result of their population, now at 1.3 billion persons。
而其他的一些国家,特别是印度,由于人口增长,版图则发生了巨大变化。目前,印度已经有13亿人口。
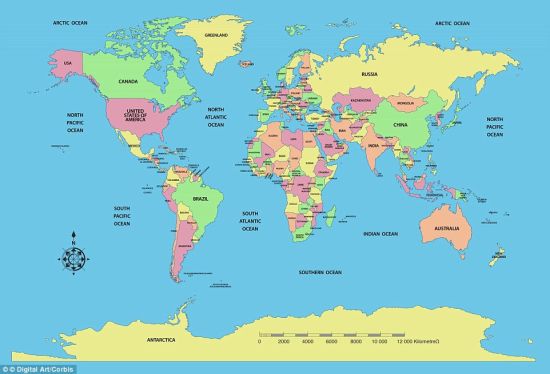
 正常的世界地图
Countries with smaller populations, including Australia, Canada and Russia, are notably reduced on the map。
此外,在地图上,那些人口较少的国家版图却在急剧缩小,包括澳大利亚、加拿大和俄罗斯。
China's land mass on the map has also increased thanks to its population of 1.4 billion。
中国高达14亿的人口也是其在地图上占据大片江山。
Other nations like Fiji with 859,000,Iceland with 328,000, and Malta with 416,000, have been scaled down to a micro square。
另外一些国家,例如斐济(859,000),冰岛(328,000)和马其他(416,000),所占版图微乎其微。
Countries with less than 250,000 - such as Greenland which has a population of 56,000 - were too small to appear on the cartogram。
而人口少于250,000的国家,例如格林兰岛(56,000),则因人口太少而未曾出现在统计图上。
The map is an updated version ofthe first one released by the same creator 10 years ago。
十年前,这一用户也制作过相同的地图,目前的这幅是升级版。
Since then, it shows that India has grown by almost 200 million people while China has increased by about 60 million。
地图显示,10年间,印度的人口增长了近2亿,而中国的人口增加了约6000万。
Australia's population, according to the map, has risen by more than three million since 2005.
根据地图,自2005年以来,澳大利亚的人口增加了300多万。
And, once again, the United States and United Kingdom seem to be growing at a steady and proportionate rate.
此外,美国和英国的人口正以稳定而合理的速度增长。
(来源:《每日邮报》;编译:Heidi)

