2010年考研复习:名师指导最牛英语范文
【题目要求】 WRITING (50 points)
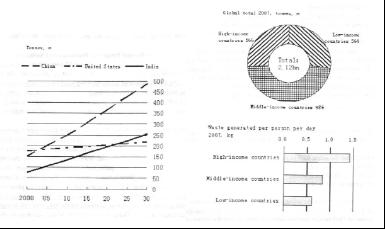
The graphs below give information about waste generation. Summarise the information reporting the main features, and make comparisons where relevant. Write at least 200 words。

【题目分析】
本题属于图表类作文,通过观察题目给出的三幅图表作文。这三幅图表饼图、条形图、折线图各一,都是跟废弃物产生有关,除了图表之外,题目在写作要求部分几乎再没有任何相关提示的语句,所以完全需要考生自行识解图表信息。但题目中给出了总结图表信息和必要时作比较这两个要求,写作时应紧紧围绕这两个要求来写。
【写作攻略】
针对这样的题目,考生要首先正确理解图表信息:饼图给出的是2007年全球产生废弃物的总体情况,中等收入国家约占一半,高收入和低收入国家大约各占四分之一;条形图反映的是2007年日均人均产生废弃物的量,从多到少依次是高收入、中等收入和低收入国家;折线图说的是中国、美国、印度这三个国家各自的情况。然后根据题目要求,对以上信息作一总结,交代出重要数据,在相关的时候对三个图表中的数据进行比较,然后得出结论。
【参考范文】
On Waste Generation
A series of charts provides information on waste generation across the globe and in three individual countries. From the graphs, it is seen that huge amounts of waste are being produced and waste production will continue to be a serious problem in the years to come。
According to the pie chart, the total waste generation on earth reaches 2.12 tons in 2007. Middle-income countries account for nearly half of it, high-income and low-income countries about a quarter respectively. However, judging from the perspective of individual waste generation, people in high-income countries are more responsible, with nearly 1.5 kilograms of waste generated per person per day. In comparison, people in middle- and low-income countries are less responsible for producing waste, about 0.8 and 0.6 kilogram’s per capita waste production each day in 2007, as shown in the bar chart. Population in middle-income countries is far larger than that of high-income ones; therefore, a bigger proportion of the gross value of waste generation is taken up by middle-income countries。
The line chart shows the prediction of waste production in China, the United States and India, in the coming years. China has the sharpest increase compared with the other two countries, possibly reaching 500 million tons in the year 2030. The annual waste generation of the United States will remain stable around 200 tons, with just a slight rise each year. As for India, the figure starts low in 2000, but has a growing tendency and will surpass the US around 2020. Both the US and India are below China most of the time in terms of waste generation。
Measures should be taken to cope with this serious problem. Our country, with a large population and a large potential of generating wastes, should assume the responsibility to combat it; it is hoped that we can slow down the increase。
特别说明:由于各方面情况的不断调整与变化,新浪网所提供的所有考试信息仅供参考,敬请考生以权威部门公布的正式信息为准。
网友评论
相关链接
- 考研专业课指导:中医学理论体系解读2009-10-10 16:22:27
- 指导:2010年考研专业课金融学复习要点2009-10-10 16:17:30
- 考研专业课金融学 复旦大学学习提要2009-10-10 13:31:08
- 复习考研专业课:现代文学必备知识点2009-09-28 17:05:59
- 备战考研专业课:现代文学经典笔记2009-09-28 17:05:02
- 牛人辈出 经济学考研专业四大就业方向2009-09-28 13:13:10
- 经济学考研专业整体概况及研究方向解析2009-09-28 12:59:41
- 考研专业课:微机原理部分试题解答2009-09-25 11:50:15
- 考研专业课:西方经济学试题汇总2009-09-24 18:07:00
- 考研专业课:西方经济学名词解释汇编2009-09-24 18:03:12
- 盘点:考研专业十大流行金曲之医学2009-09-24 11:49:06


